Reporting
We’ve recently rolled out the Event Management Report, providing a list of generator runs for a period of time by site and system. Refer to the next section for more on Aurora’s Reports.
Report Activity
The report functionality in Aurora on-prem facilitates analytics on most data points that are logged and persisted according to the rollup options configured in the Aurora Admin module, by your administrator. By default, the platform is configured with the following intervals: minutes, quarter hour, hour, and day. Use this chart as a guide on what granular resolution will be available for data point trending.
These rollup rules are in force to improve performance on the server as minute-level resolution is highly intensive and cannot be persisted indefinitely. However, event-related data is saved in seconds and stored indefinitely assuming existing infrastructure.
Data Interval Persistence Without Events
Interval (Resolution) | Data Persisted |
|---|---|
Minutes | 32 days |
¼ Hour | 1 year |
Hourly | 3 years |
Days | 3 years |
Persistence of discrete, binary data is subject to system storage capacity.
Trend data is also available from Entity Details and Event Details.
Trends Views for Analog Data Points
Click to select the reports icon in the page banner or header; the platform will open the trending tab, as provided here.
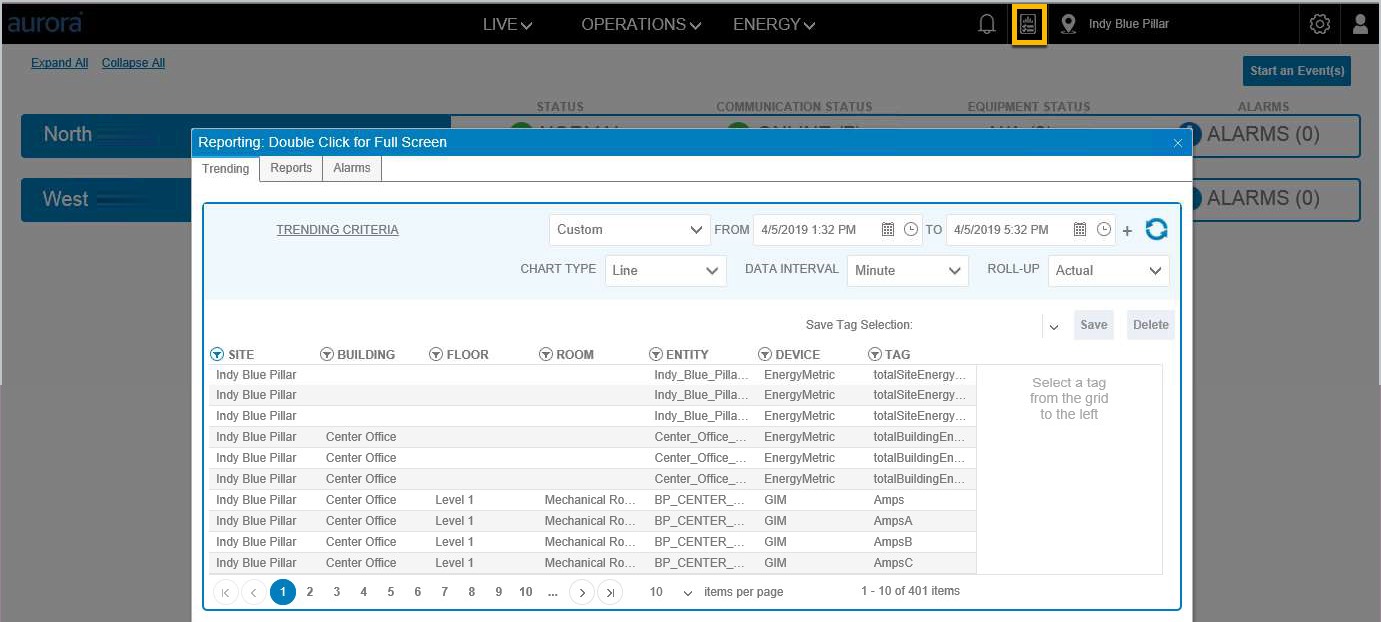
Enter a desired time period for the report in the From and To date fields or select the Custom list of values and select a pre-defined period time.
Select the Chart Type (line graph is the default selection). These are defined in the table in this section.
Discrete data trending does not require a chart type selection or a data interval selection. Discrete data is only available in a Data Grid and with an Actual Value.
When 10 or fewer tags are selected, these output options are supported: | |
|---|---|
Line Chart | Displays data as a line graph. |
Data Grid | Displays data in a grid format. |
Download | Downloads the data results to a .csv file with the option to open or save to location. |
Export To Email | Creates .csv file and emails the file to the requested recipients. |
Export To File | Saves a .csv file to a file location on the server. |
When 11 or more tags are selected, these output options are supported: | |
Export To Email | Creates a .csv file and emails file to requested recipients. |
Export To File | Saves a .csv file to a file location on the server. |
Select the Data Interval (Minute, Qtr Hour, Hour, Day); platform default is the best interval option based on the date range selected.
Select the Roll-up (Avg, Min, Max); platform defaults to Actual.
To filter the grid for tag selection, select the filter icon next to the column header.
To sort the tag list ascending and descending double click the column header.
Click on the tags in the grid to include them on the report; the platform will display the selected tags in the panel on the right side of the screen.
To create a trend chart, select the refresh icon, as highlighted here; the platform displays the data points for the selected chart type.
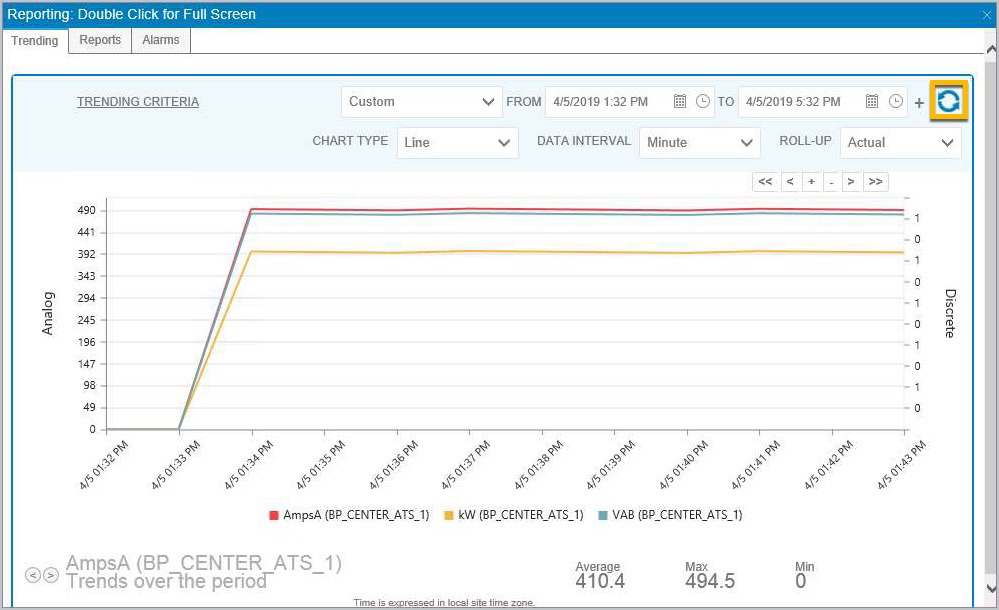
Trend Data Sample for Analog
Use the (back arrow) and (forward arrow) buttons to view a time series of the data points.
Click the tag name or color block in the graph legend to toggle the data on/off on the display.
Use the (<<), (<), (+), (-), (>) and (>>) buttons to navigate back or forward in time.
To return to the landing page, click the Trending Criteria link in the sectional header.
Comparing Different Time Periods
Click the Reports icon.

Use the + icon adjacent to the initial date/time range to make time series comparisons. This will add another row for the date/time range.

Adding Time-Date Range
Enter the desired time period for the report in the From and To date fields or select the Custom list of values and select a date range.

Time-Date Comparison
To sort by tag selection, select the filter icon next in the column header. To sort the tag list ascending and descending double click the column header.
Click the tags in the grid to include them on the report; the platform will display the selected tags in the panel on the right.
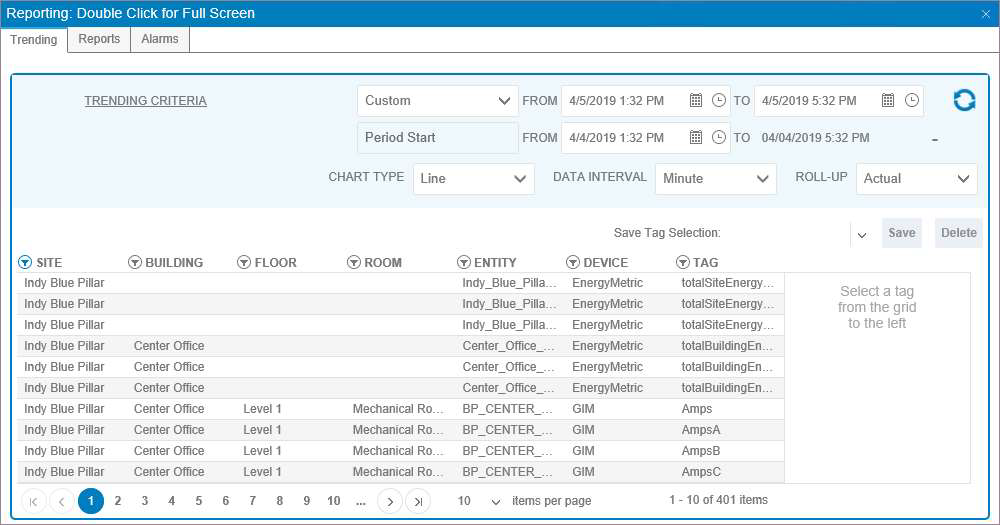
Selecting Tags
Any selected tags populated the modal screen right.
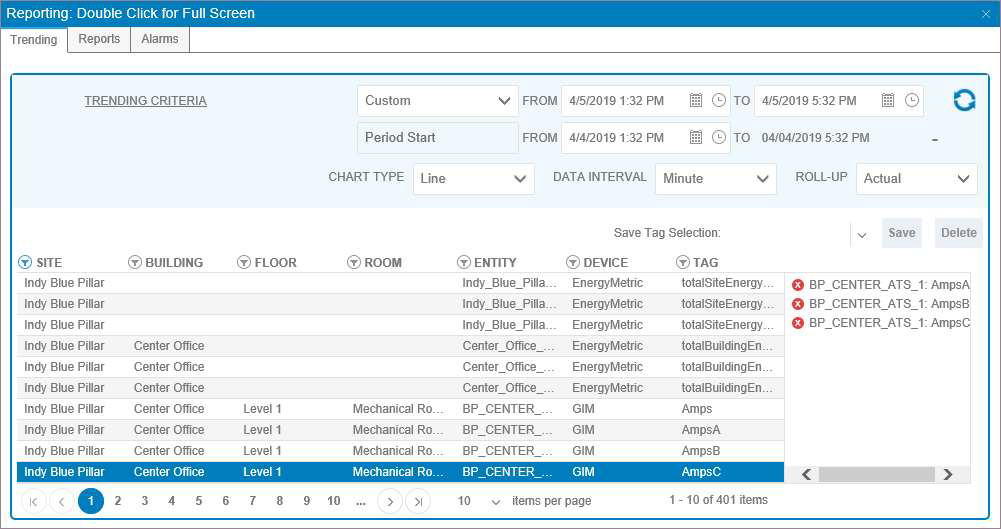
Prepping Chart Selection
Click the refresh button to view the data point comparison on screen.

Comparison of Two Time Series
Discrete data Trending does not require a chart type selection or a data interval selection. Discrete data is only available in a Data Grid and with an Actual Value.
Generate a Report
Aurora On-prem provides a group of reports that provide real-time operational information. Please refer to Event History for detail on Compliance Reports.
Select the reporting icon in the platform header; the platform displays the trending screen.
Click the Reports tab.
Select a report from the drop-down menu.
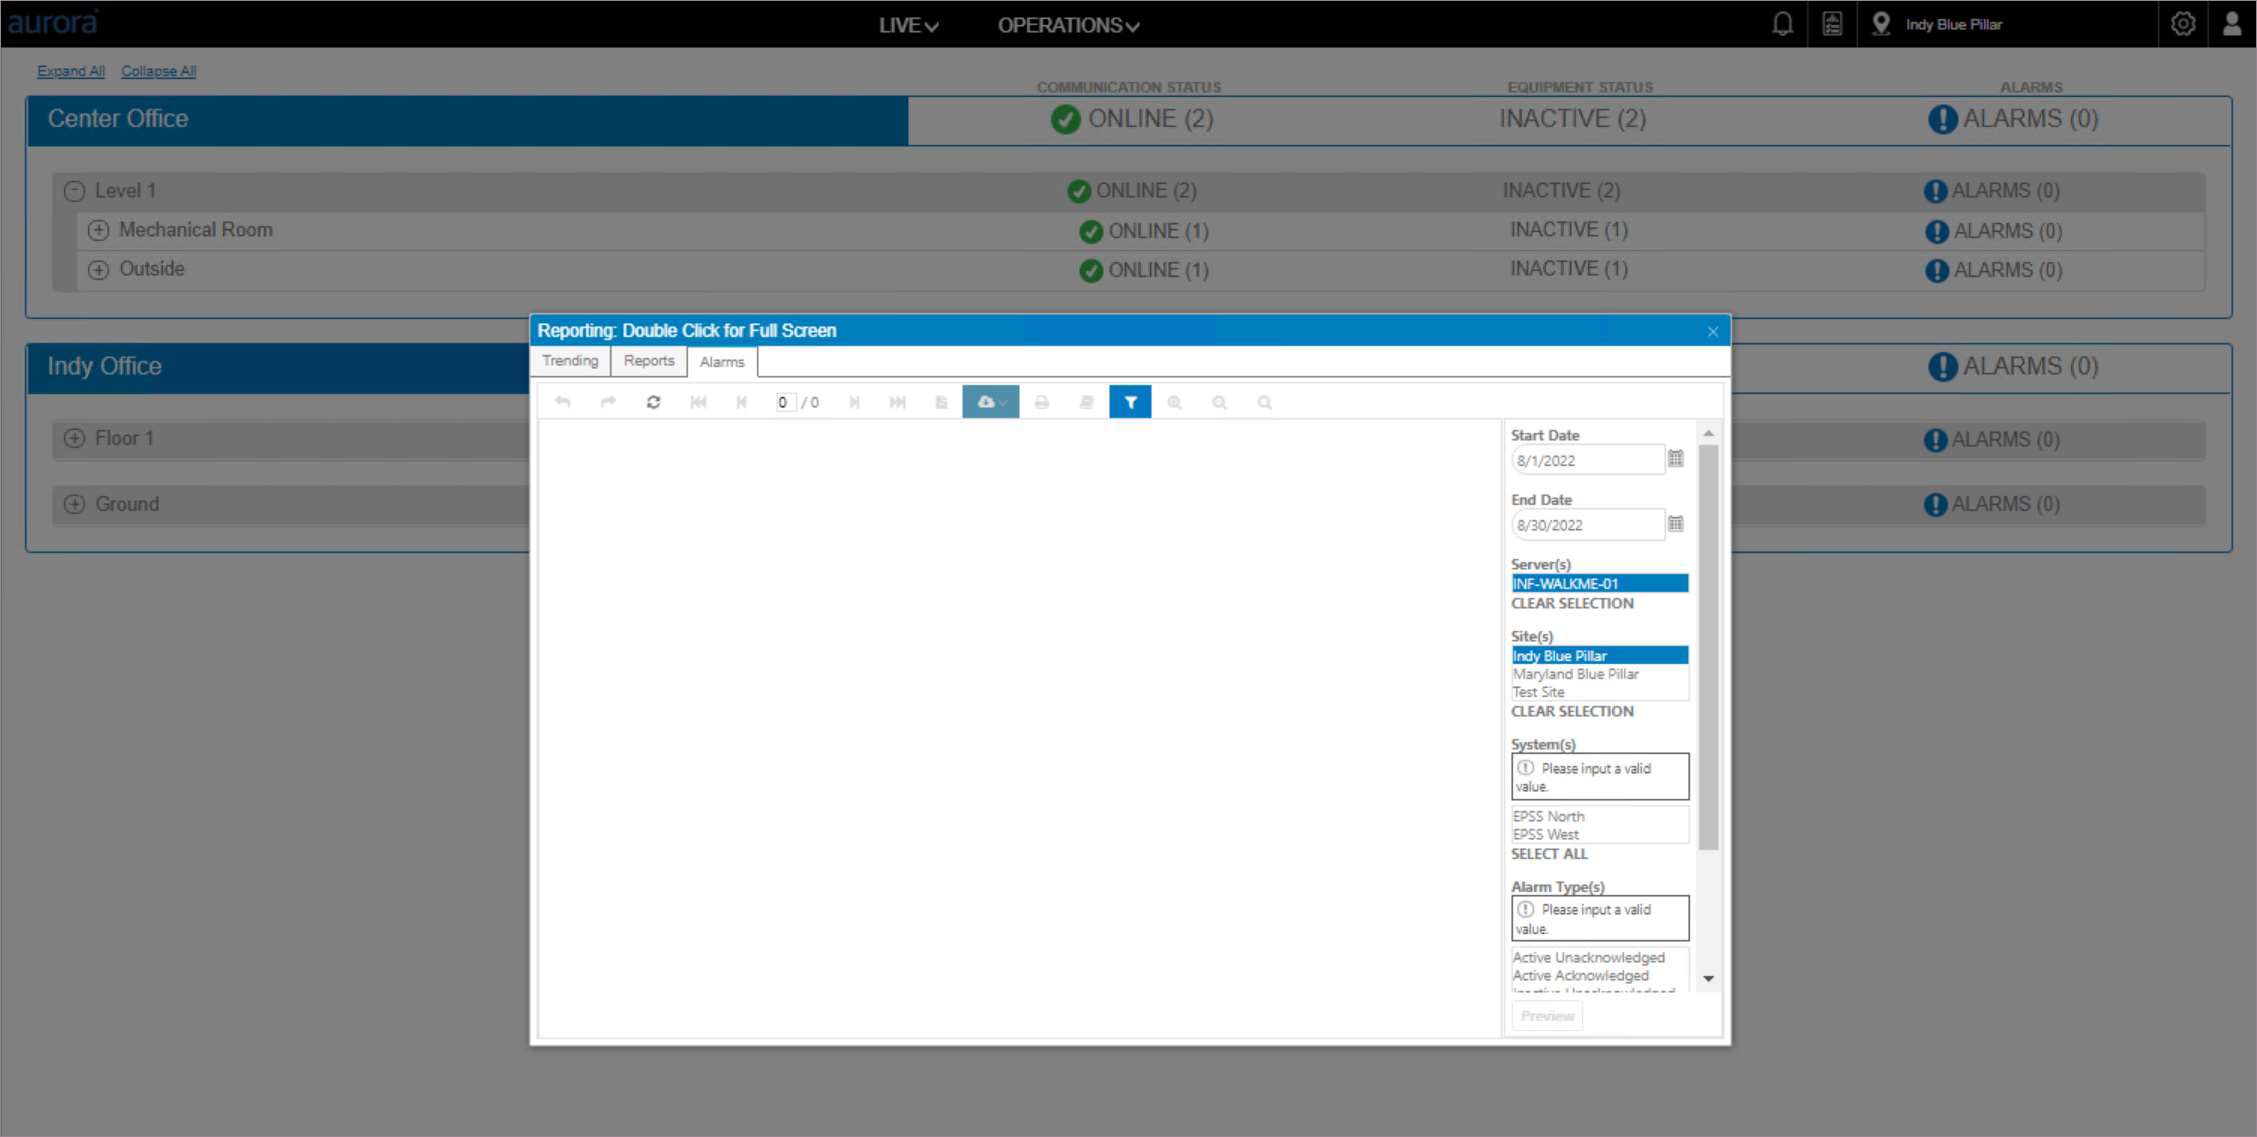
Once a report is selected from the list, the platform offers report criteria fields, including date-time range, Server(s), Site(s), and System(s).
Enter a Start Date or use the default Start Date.
Enter an End Date or use the default End Date.
If applicable, select Site(s); the platform will use the default if only one is available.
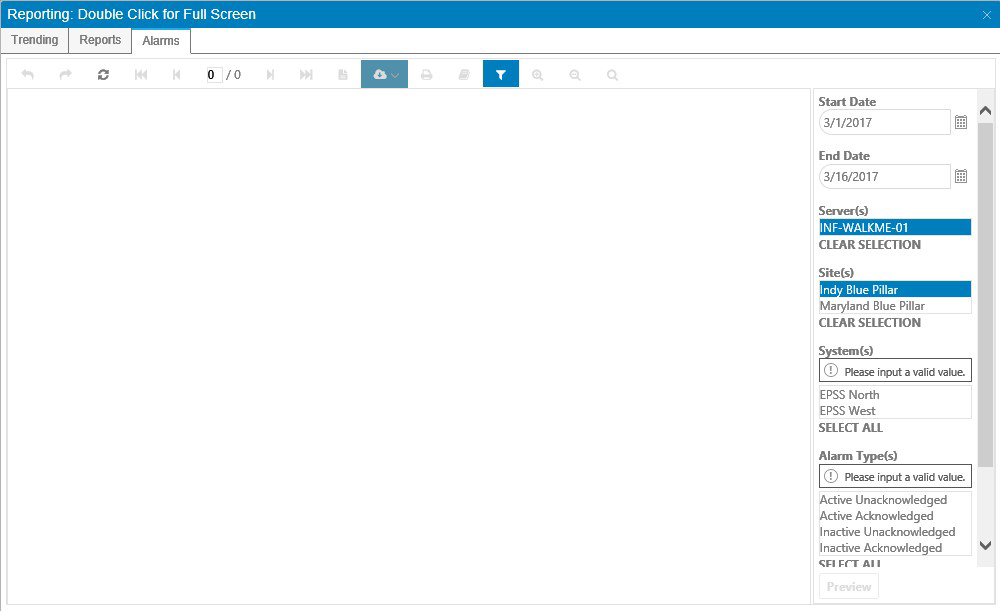
Report Parameter Selection
If applicable, select System(s); the platform will use the default if only one server is available.
Select the Preview option to display the report in the report viewer.
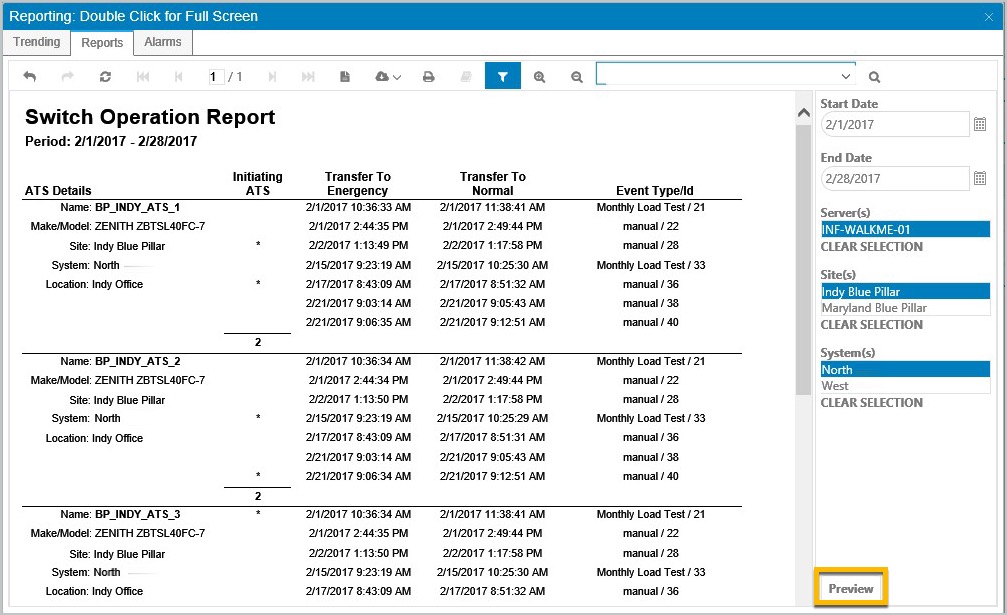
Sample Switch Operation Report
To export the report, hover over the cloud download icon in the report view header; the platform will display a list of supported file types.
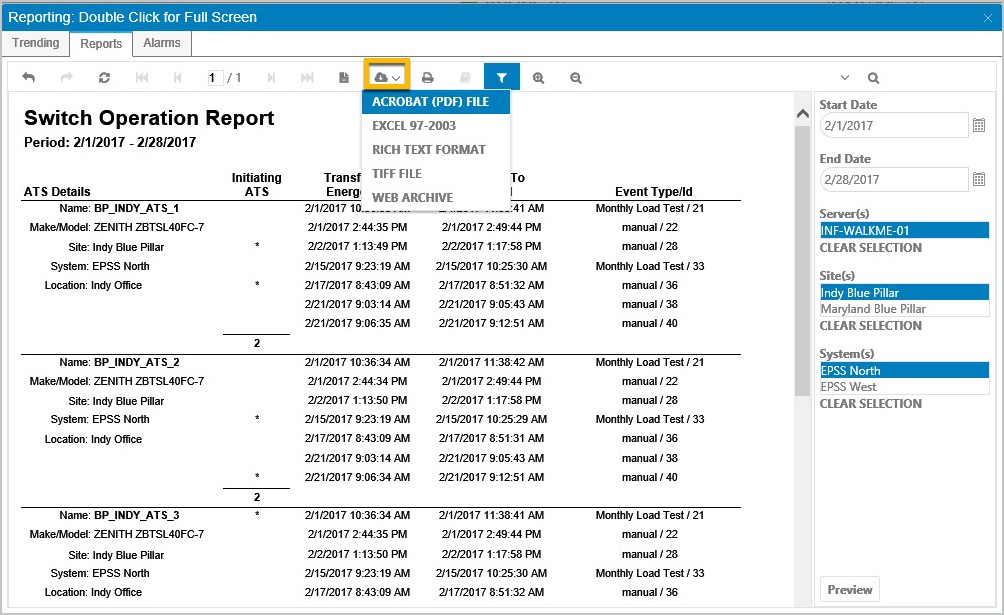
Report Export
Select the file type for export. You can Open, Save, or Cancel the request.

Choose Open to view the file from the compatible application.
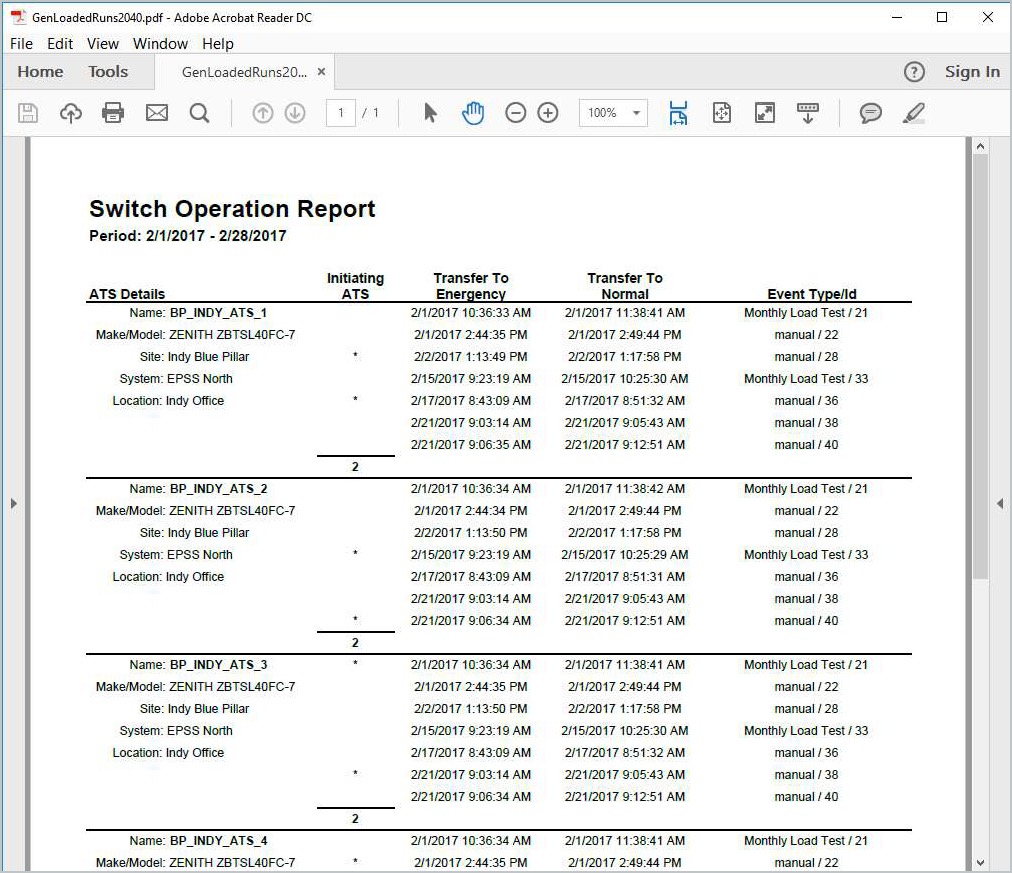
Viewing Report from File
Alarm History Report
Historical Alarm information is available in the Alarm History report. It can provide Active and Inactive Alarms, as well as acknowledged and cleared dates.
Generate Alarm History Report
Select the reporting icon in the platform header; the platform displays a trending screen.
Click the Alarms tab to launch the Alarm window.
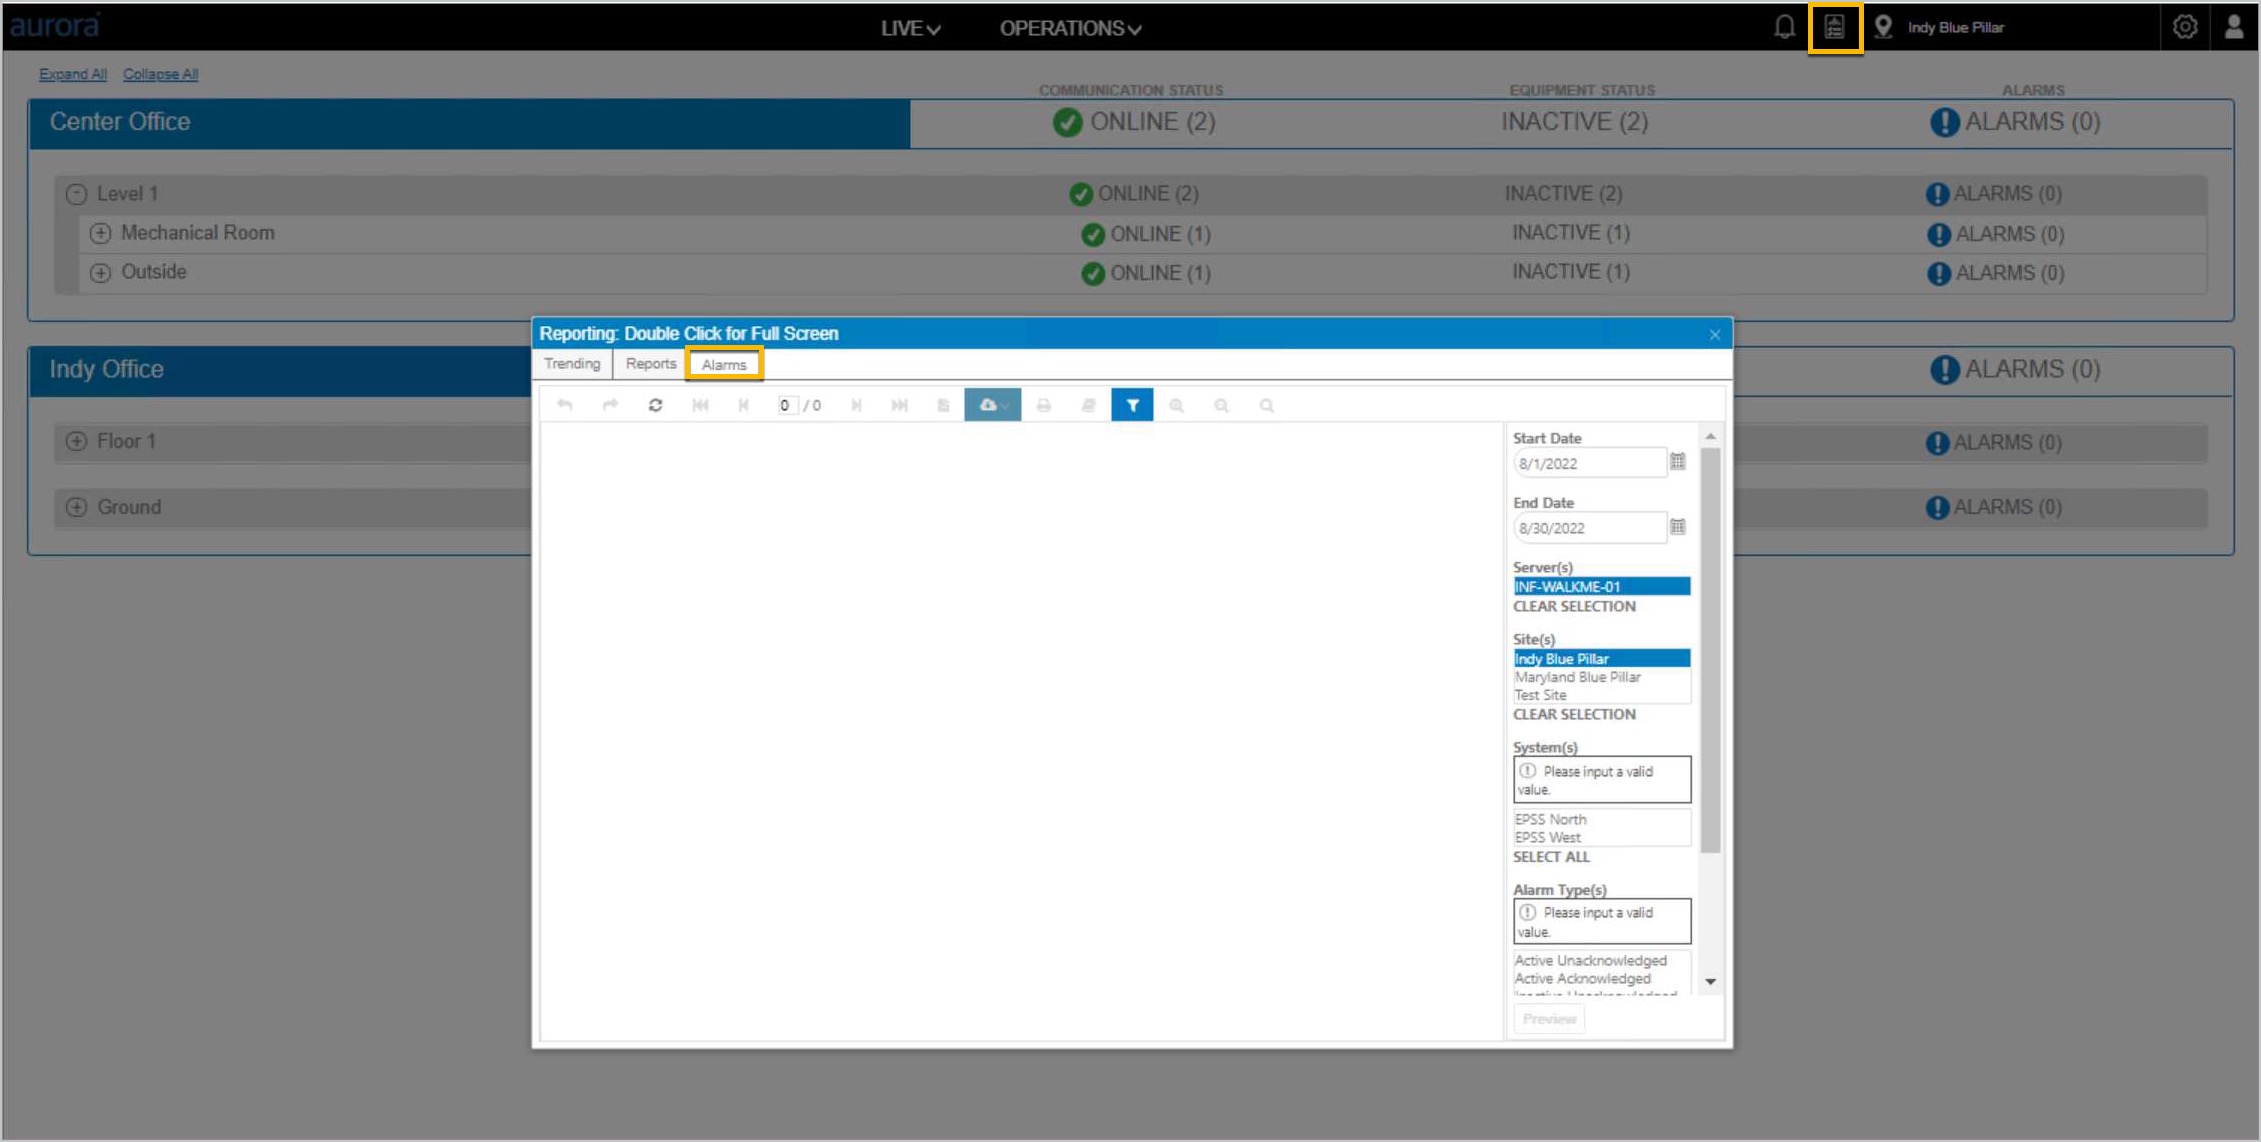
Enter a Start Date or use the default provided.
Enter an End Date or use the default provided.
Select a Site if applicable, or use the default if there is only one site.
Select a System if applicable, or use the default if there is only one system listed.
Select the Alarm Type(s) or use the Select all option.
Select the Alarm or use the Select all option.
Click the Preview option; the platform will display the report in the viewer.
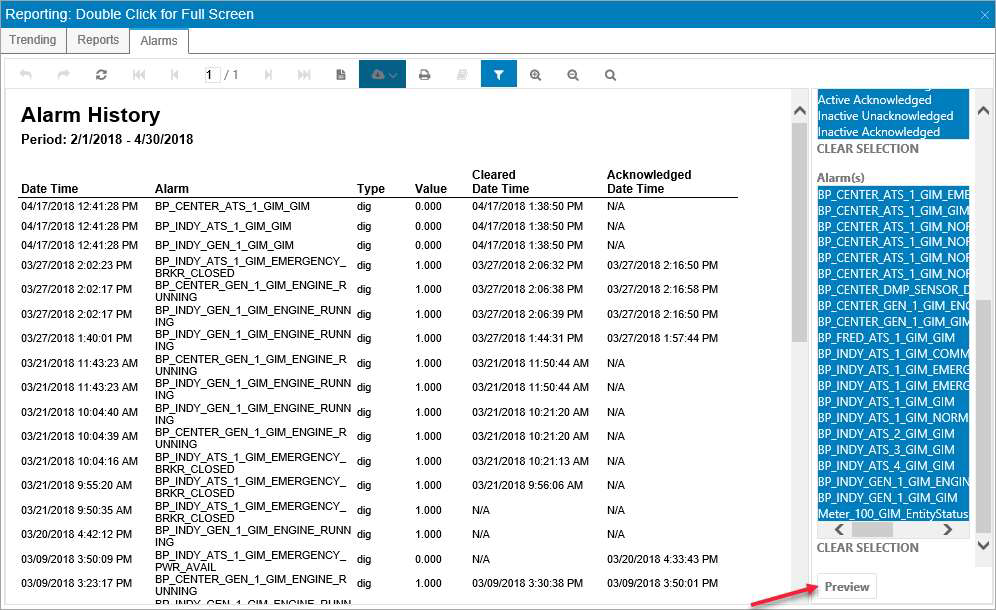
Report Preview
To export the report hover over the cloud download icon in the tool panel; the platform will display a list of export options.
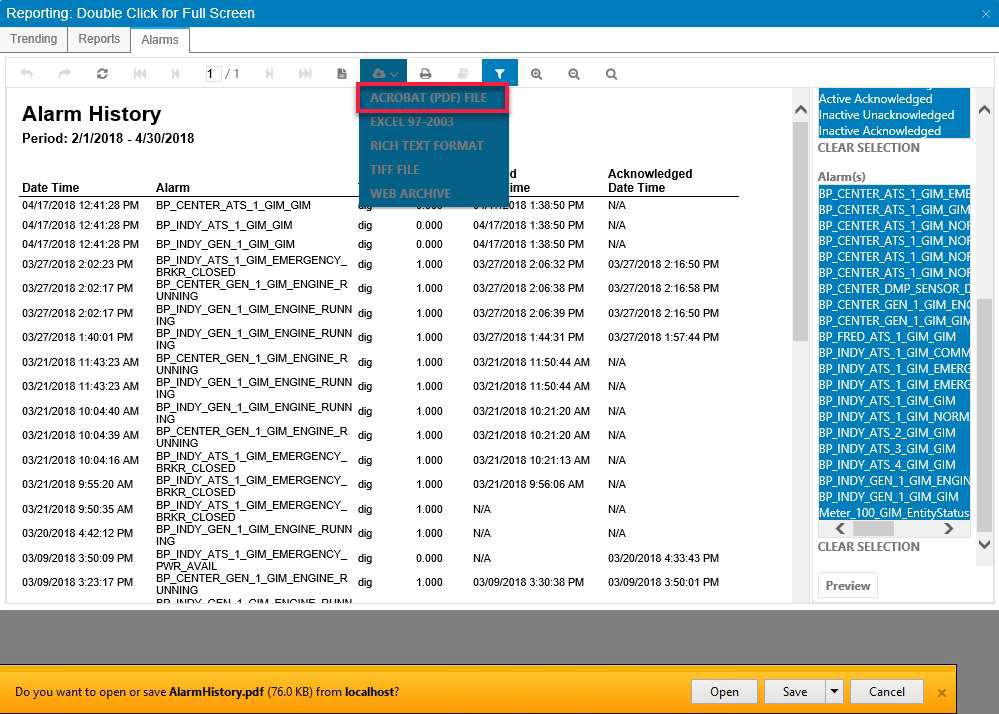
Report Download
