Emergency Power Management System
Aurora On-prem provides emergency power supply testing in order to facilitate reports for regulatory compliance, operational test information, and for system troubleshooting.
For monthly load tests, the generator(s) supporting operations are typically expected to demonstrate that they are able to hold a 30 percent load for 30 minutes. In the case of health care facilities, ATS tests also ensure that power is provided for those portions of the building dedicated to critical life safety.
See also the Emergency Power Management System topic.
To access the EPMS:
Select the Operations menu option.
Select EPMS from the Operations drop-down menu so that the platform displays the EPMS page.
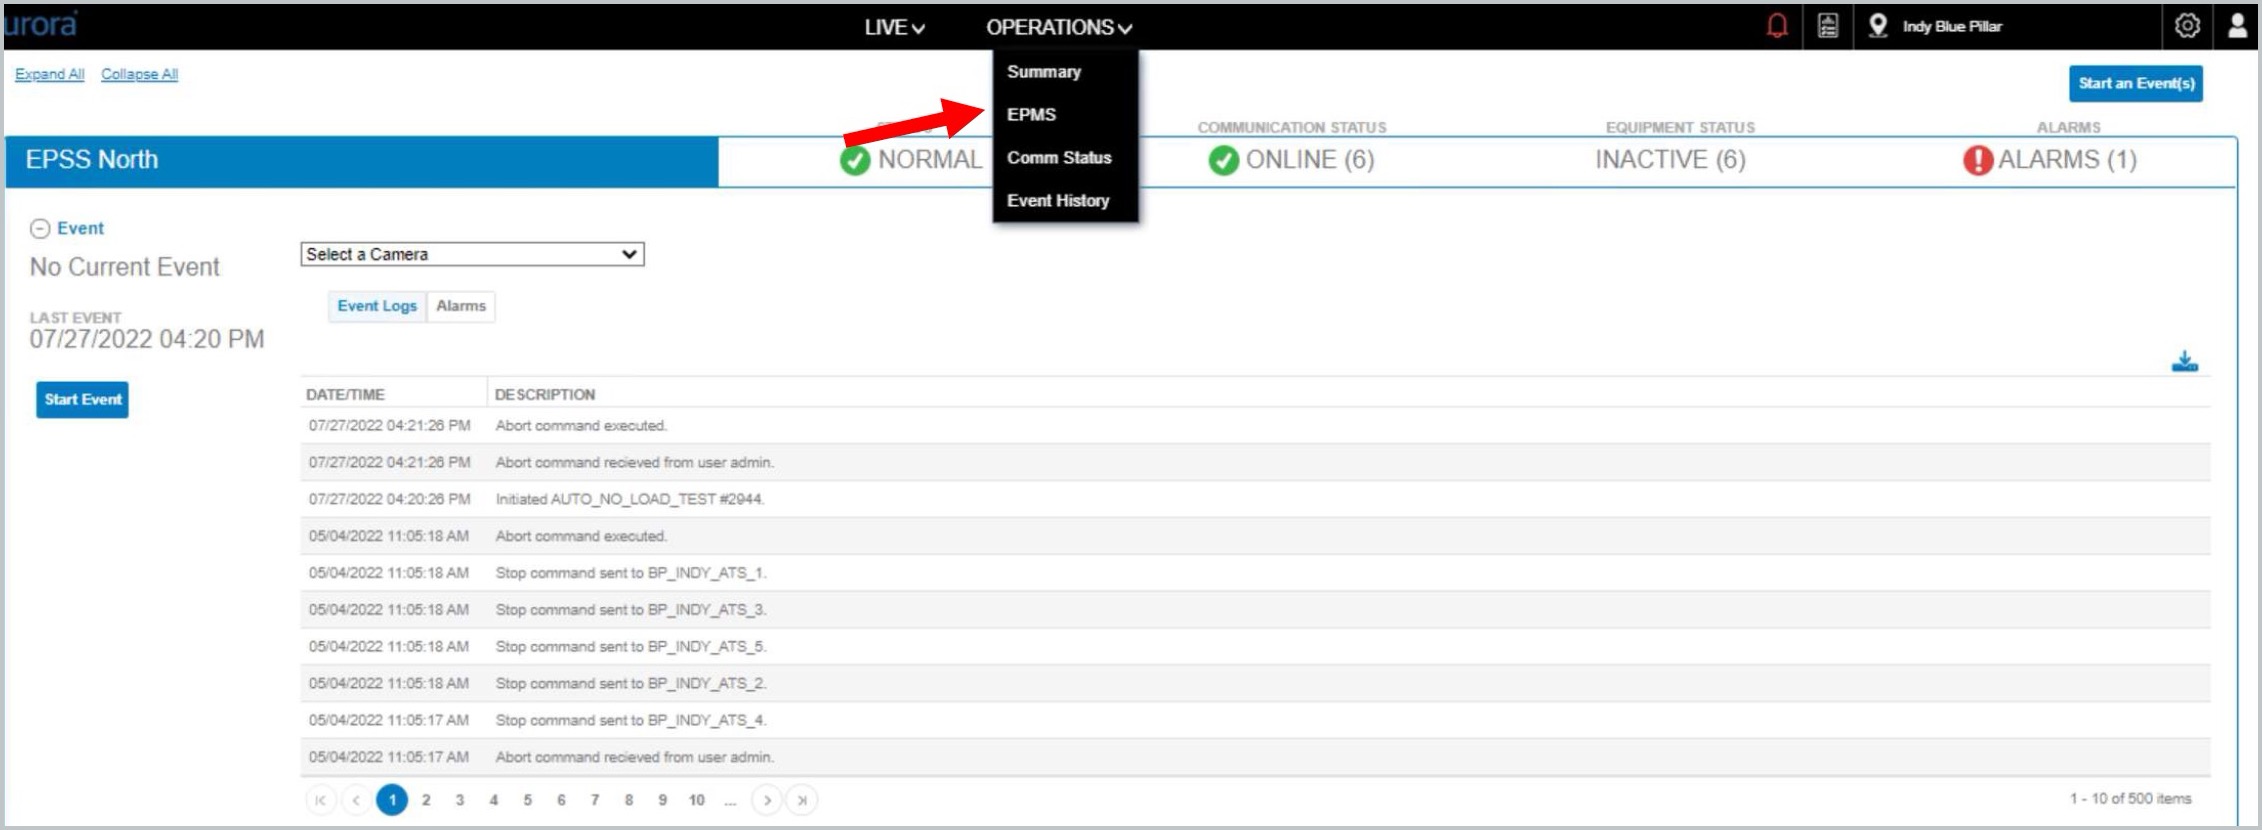
EPMS Functionality
To collapse/expand sections of the screen use the (-) and (+) buttons next the section title or the Expand All/Collapse All options in the upper right-hand corner.
Status Indicators
This section lists the range of status values by system, feature, and equipment.
System Status
NORMAL
TESTING
LOAD REDUCTION
OUTAGE
ERROR
Equipment Status
ACTIVE: Running on backup power
INACTIVE: Ready and on utility power
NOT READY: Generator not in Auto mode
IGNORE: ATS in Maintenance mode in Aurora
UNKNOWN: Uncertain of Status Alarm Indicator
Communication Status
OFFLINE
ONLINE
Alarm Indicator
No Alarms
Active Alarms
Unacknowledged Alarms
If there is more than one status occurring simultaneously, the display will toggle between status values.
Equipment Detail Via EPMS Feature
Select an equipment row on the EPMS view in the Equipment Details header section so that the platform can display equipment details.
In the upper right area of the screen of the Entity Details there are several options for viewing data associated with the entity.
Alarm Indicator (Icon) | Viewing Additional Information |
Click to select the entity alarm. If the icon is illuminated, active alarms will be highlighted on the page.
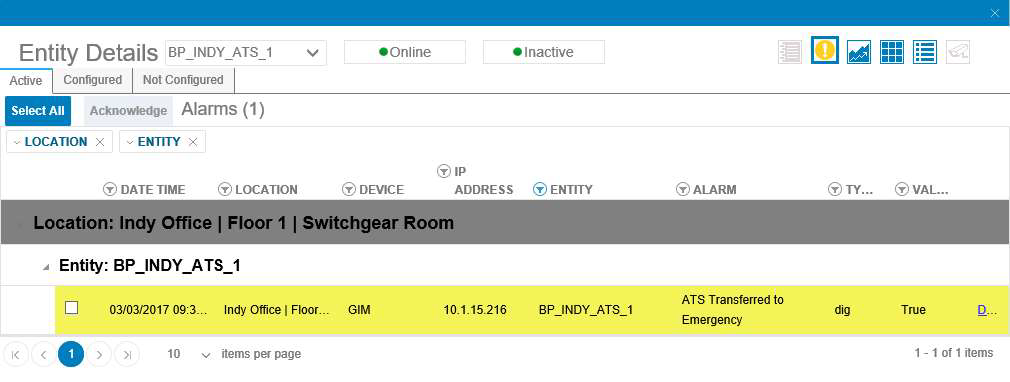
Entity trends and reports are contained in the system, along with the ability to sort by trending criteria.
 Trend Data (Icon) | 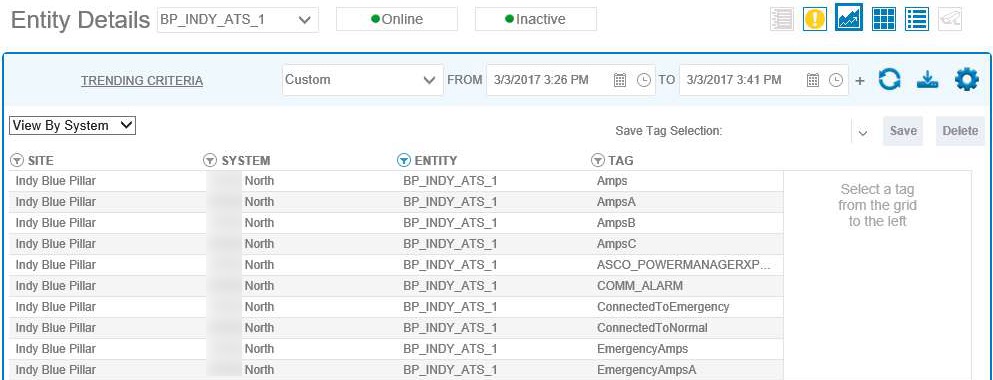 Data by System Trending Criteria |
Live data points and their respective values are accessible by clicking the Live Data icon.
Live Data Points (Icon) | 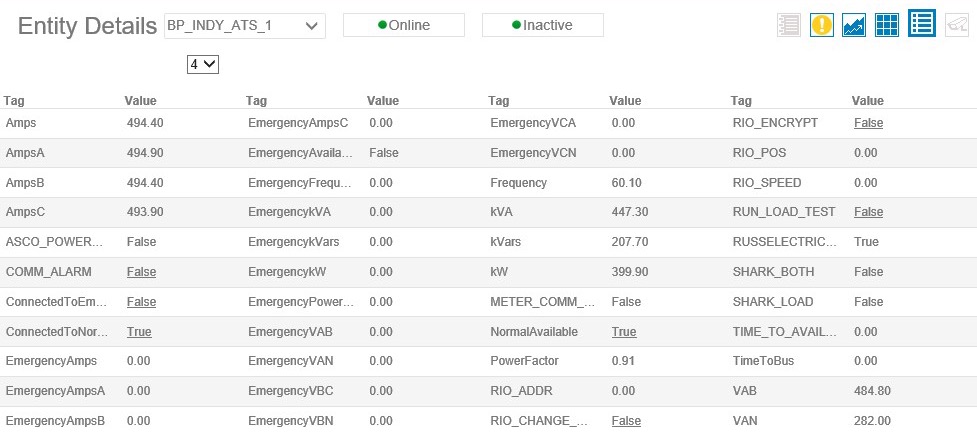 Live Entity Data Points |
Click the default entity icon to view the default Entity Details page.
Default Entity Template (Icon) | 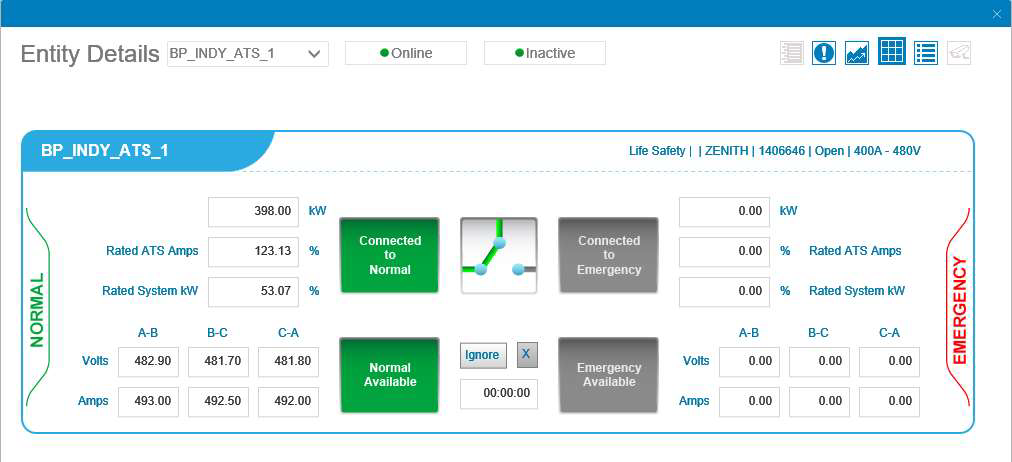 Entity Details Using Default Template |
If configured and enabled, select the camera icon to obtain a live view of the generator. A new web browser window will pop up requesting the username and password to access the generator camera. Contact Support for your obtain credentials.
Camera Icon in Toolbar |  Live Camera View |


